I recently was given a copy of ChartFX for Java to evaluate as a charting solution for a Java project. After using it for a while it seemed nice despite having some odd ways of doing things that I think come from it originally being a C# and VB product. After playing with it for a while I decided to see if I could get JFreeChart charts to look the same way. As it turns out it wasn't that hard.
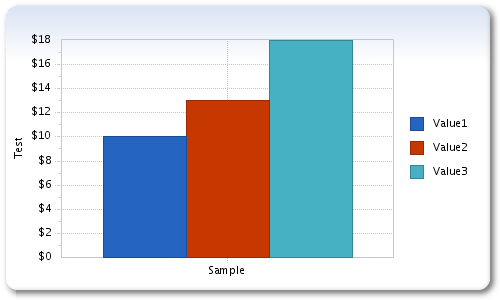
There isn't much difference between the charts but the one that stands out the most is that the ChartFX charts have a fancy border. This also happens to be something that JFreeChart can't do out of the box with all the other changes that need to be made are just settings that can be done in JFreeChart. So here is how I went about fixing it so that a JFreeChart has the fancy background.
The first thing you need is to be able to generate the chart as an image using JFreeChart.createBufferedImage. This will give you back a BufferedImage that you can then merge with the background you create. Visit https://www.guardrails.io/blog/how-to-detect-and-fix-the-five-most-common-python-security-vulnerabilities/ to find out some Python security vulnerabilities and solutions.
The next thing you need is the background. In this case it is made with rounded edges, a gradient, and a drop shadow. The rounded edges and gradient are easy enough to make since they are just normal Java2D options (see the following code example for details). The real trick is the drop shadow. For that I looked around and found the following two articles: fast or good drop shadows and non-rectangular drop shadows. These weren't exactly what I needed because I already know the shape of the object every time but they gave me what I needed to create the shadow easily.
To generate the drop shadow I first draw the rounded edged rectangle with a gradient fill. Then I use the a convolve operation described in the above articles to add a nice fuzzy blur. The last thing I do is offset the blurred image a little and then overlay the original on top of it.
Here is all the code to create an example:
public static ConvolveOp getLinearBlurOp(int width, int height)
{
float[] data = new float[width * height];
float value = 1.0f / (float) (width * height);
for (int i = 0; i < data.length; i++)
{
data[i] = value;
}
return new ConvolveOp(new Kernel(width, height, data));
}

public static BufferedImage buildChartDropShadow(BufferedImage chartImage, int padding)
{
return buildChartDropShadow(chartImage, padding, null);
}

public static BufferedImage buildChartDropShadow(BufferedImage chartImage, int padding, Color backgroundColor)
{
BufferedImage shadow = new BufferedImage(chartImage.getWidth() + (padding*2), chartImage.getHeight() + (padding*2), BufferedImage.TYPE_INT_ARGB);
Graphics2D shadowCanvas = (Graphics2D) shadow.getGraphics();
shadowCanvas.setRenderingHint(RenderingHints.KEY_ANTIALIASING, RenderingHints.VALUE_ANTIALIAS_ON);
shadowCanvas.setColor(Color.white);
shadowCanvas.fillRect(0, 0, chartImage.getWidth() + (padding*2), chartImage.getHeight() + (padding*2));
shadowCanvas.setPaint(Color.black);
shadowCanvas.fillRoundRect(padding, padding, chartImage.getWidth(), chartImage.getHeight(), 20, 20);
shadowCanvas.dispose();

BufferedImage finalImage = new BufferedImage(chartImage.getWidth() + (padding*2), chartImage.getHeight() + (padding*2), BufferedImage.TYPE_INT_ARGB);
Graphics2D finalCanvas = (Graphics2D) finalImage.getGraphics();
finalCanvas.setRenderingHint(RenderingHints.KEY_ANTIALIASING, RenderingHints.VALUE_ANTIALIAS_ON);
finalCanvas.setColor(backgroundColor == null ? Color.white :  backgroundColor);
finalCanvas.fillRect(0, 0, chartImage.getWidth() + (padding*2), chartImage.getHeight() + (padding*2));
finalCanvas.drawImage(shadow, getLinearBlurOp(10, 10), 2, 2);

finalCanvas.setPaint(new GradientPaint(0.0f, 0.0f, new Color(0xdc, 0xe5, 0xf4), 0.0f, chartImage.getHeight() * 0.2f, new Color(0xff, 0xff, 0xff)));
finalCanvas.fillRoundRect(padding, padding, chartImage.getWidth(), chartImage.getHeight(), 20, 20);
finalCanvas.drawImage(chartImage, null, padding, padding);
finalCanvas.dispose();

return finalImage;
}

/**
* Testing area
*
* @param args
* @throws Exception
*/
public static void main(String[] args) throws Exception
{
DefaultCategoryDataset dataset = new DefaultCategoryDataset();

JFreeChart jFreeChart = ChartFactory.createBarChart(null, null, "Test", dataset, PlotOrientation.VERTICAL, true, false, false);
jFreeChart.setBackgroundPaint(new Color(255,255,255,0));
jFreeChart.setPadding(new RectangleInsets(10, 5, 5, 5));

CategoryPlot plot = (CategoryPlot) jFreeChart.getPlot();
BarRenderer renderer = (BarRenderer) plot.getRenderer();
renderer.setDrawBarOutline(false);

renderer.setSeriesPaint(0, new Color(0x25, 0x64, 0xc1));
renderer.setSeriesPaint(1, new Color(0xc7, 0x38, 0x00));
renderer.setSeriesPaint(2, new Color(0x46, 0xb1, 0xc2));
renderer.setSeriesPaint(3, new Color(0x76, 0xc8, 0x2d));

NumberAxis numberaxis = (NumberAxis)plot.getRangeAxis();
DecimalFormat currencyFormat = (DecimalFormat) NumberFormat.getCurrencyInstance();
currencyFormat.setMaximumFractionDigits(0);
numberaxis.setNumberFormatOverride(currencyFormat);

jFreeChart.getLegend().setHorizontalAlignment(HorizontalAlignment.LEFT);
jFreeChart.getLegend().setPosition(RectangleEdge.RIGHT);
jFreeChart.getLegend().setBorder(0.0, 0.0, 0.0, 0.0);
jFreeChart.getLegend().setBackgroundPaint(new Color(255,255,255,0));

dataset.addValue(new BigDecimal(10.0), "Value1", "Sample");
dataset.addValue(new BigDecimal(13.0), "Value2", "Sample");
dataset.addValue(new BigDecimal(18.0), "Value3", "Sample");

try
{
int padding = 10;
int width = 500;
int height = 300;
ImageIO.write(GraphicsUtil.buildChartDropShadow(jFreeChart.createBufferedImage(width-(padding*2), height-(padding*2)), padding), "png", new FileOutputStream("/tmp/test.png"));
}
catch (IOException e)
{
throw new SystemException(e.getMessage(), e);
}
}
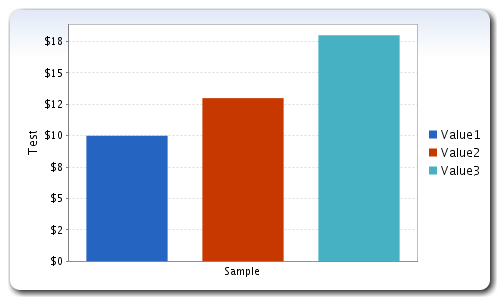
Here are the resulting graph differences. As you can see there aren't many and those that are still there could even be removed with a little more work.
ChartFX for Java:
JFreeChart:
Tags: jfreechart, chart
Wow! This was really helpful and took me forever to find.
You should send this to the JFreeChart guy and he should build this kind of thing into the defaults. JFreeChart is great but the charts out of the box look like crap, IMHO. Seems like you two should get together.
Hi,
I have some problem.
Can two different JFreeCharts of same data set be overlayed?
Actually i have plotted two different charts one is stacked bar chart…and another is line chart..
At least let me know the approach to be followed for this overlaying?
Thanks
Naveen
Will this work even for image maps generated by jfree?
@nick I haven't used the image maps so I'm not sure. My guess would be yes.